Optimization story: Bloom inference

This article gives you the behind-the-scenes of how we made an efficient inference server that powers bloom. inference server that powers https://huggingface.co/bigscience/bloom.
We achieved a 5x latency reduction over several weeks (and 50x more throughput). We wanted to share all the struggles and epic wins we went through to achieve such speed improvements.
A lot of different people were involved at many stages so not everything will be covered here. And please bear with us, some of the content might be outdated or flat out wrong because we're still learning how to optimize extremely large models and lots of new hardware features and content keep coming out regularly.
If your favorite flavor of optimizations is not discussed or improperly represented, we're sorry, please share it with us we're more than happy to try out new stuff and correct our mistakes.
Creating BLOOM
This goes without saying but without the large model being accessible in the first place, there would be no real reasons to optimize inference for it. This was an incredible effort led by many different people.
To maximize the GPU during training, several solutions were explored
and in the end, Megatron-Deepspeed was chosen to train the end model.
This meant that the code as-is wasn't necessarily compatible with the transformers
library.
Porting to transformers
Because of the original training code, we set out to do something which we regularly
do: port an existing model to transformers. The goal was to extract from the
training code the relevant parts and implement it within transformers.
This effort was tackled by Younes.
This is by no means a small effort as it took almost a month and 200 commits to get there.
There are several things to note that will come back later:
We needed to have smaller models bigscience/bigscience-small-testing and bigscience/bloom-560m. This is extremely important because they are smaller, so everything is faster when working with them.
First, you have to abandon all hope to have exactly the same logits at the end down to the bytes. PyTorch versions can change the kernels and introduce subtle differences, and different hardware might yield different results because of different architecture (and you probably don't want to develop on a A100 GPU all the time for cost reasons).
Getting a good strict test suite is really important for all models
The best test we found was having a fixed set of prompts. You know the prompt, you know the completion that needs to be deterministic so greedy. If two generations are identical, you can basically ignore small logits differences Whenever you see a drift, you need to investigate. It could be that your code is not doing what it should OR that you are actually out of domain for that model and therefore the model is more sensitive to noise. If you have several prompts and long enough prompts, you're less likely to trigger that for all prompts by accident. The more prompts the better, the longer the better.
The first model (small-testing) is in bfloat16 like the big bloom so
everything should be very similar, but it wasn't trained a lot or just doesn't perform
well, so it highly fluctuates in outputs. That means we had issues with those generation
tests. The second model is more stable but was trained and saved in float16 instead
of bfloat16. That's more room for error between the two.
To be perfectly fair bfloat16 -> float16 conversion seemed to be OK in inference
mode (bfloat16 mostly exists to handle large gradients, which do not exist in inference).
During that step, one important tradeoff was discovered and implemented. Because bloom was trained in a distributed setting, part of the code was doing Tensor parallelism on a Linear layer meaning running the same operation as a single operation on a single GPU was giving different results. This took a while to pinpoint and either we went for 100% compliance and the model was much slower, or we would take a small difference in generation but was much faster to run and simpler code. We opted for a configurable flag.
First inference (PP + Accelerate)
Note: Pipeline Parallelism (PP) means in this context that each GPU will own
some layers so each GPU will work on a given chunk  of data before handing
it off to the next GPU.
Now we have a workable transformers clean version of the start
working on running this.
Bloom is a 352GB (176B parameters in bf16) model, we need at least that much GPU RAM to make it fit. We briefly explored offloading to CPU on smaller machines but the inference speed was orders of magnitude slower so we discarded it.
Then we wanted to basically use the pipeline. So it's dogfooding and this is what the API uses under the hood all the time.
However pipelines are not distributed aware (it's not their goal). After briefly
discussing options, we ended up using accelerate newly
created device_map="auto" to manage the sharding of the model. We had to iron
out a few bugs, and fix the transformers code a bit to help accelerate do the right job.
It works by splitting the various layers of the transformers and giving part of the model to each GPU. So GPU0 gets to work, then hands it over to GPU1 so on and so forth.
In the end, with a small HTTP server on top, we could start serving bloom (the big model) !!
Starting point
But we haven't even started discussing optimizations yet!
We actually have quite a bit, all this process is a castle of cards. During optimizations we are going to make modifications to the underlying code, being extra sure you're not killing the model in one way or the other is really important and easier to do than you think.
So we are now at the very first step of optimizations and we need to start measuring and keep measuring performance. So we need to consider what we care about. For an open inference server supporting many options, we expect users to send many queries with different parameters and what we care about are:
The number of users we can serve at the same time (throughput) How long does it take for an average user to be served (latency)?
We made a testing script in locust which is exactly this:
from locust import HttpUser, between, task
from random import randrange, random


class QuickstartUser(HttpUser):
    wait_time = between(1, 5)

    @task
    def bloom_small(self):
        sentence = "Translate to chinese. EN: I like soup. CN: "
        self.client.post(
            "/generate",
            json={
                "inputs": sentence[: randrange(1, len(sentence))],
                "parameters": {"max_new_tokens": 20, "seed": random()},
            },
        )

    @task
    def bloom_small(self):
        sentence = "Translate to chinese. EN: I like soup. CN: "
        self.client.post(
            "/generate",
            json={
                "inputs": sentence[: randrange(1, len(sentence))],
                "parameters": {
                    "max_new_tokens": 20,
                    "do_sample": True,
                    "top_p": 0.9,
                    "seed": random(),
                },
            },
        )
**Note: This is not the best nor the only load testing we used, but it was always the first to be run so that it could compare fairly across approaches. Being the best on this benchmark does NOT mean it is the best solution. Other more complex scenarios had to be used in addition to actual real-world performance. **
We wanted to observe the ramp-up for various implementations and also make sure that underload the server properly circuit breaked. Circuit breaking means that the server can answer (fast) that it will not answer your query because too many people are trying to use it at the same time. It's extremely important to avoid the hug of death.
On this benchmark the initial performance was (on 16xA100 40Go on GCP which is the machine used throughout):
Requests/s : 0.3 (throughput) Latency: 350ms/token (latency)
Those numbers are not that great. Before getting to work let's estimate
the best we can imagine achieving.
The formula for amount of operations is 24Bsh^2 + 4𝐵s^2h24Bsh^2 + 4𝐵s^2h where B is
the batch size, s the sequence length, and h the hidden dimension.
Let's do the math and we are getting 17 TFlop for a single forward pass.
Looking at the specs of A100 it claims 312 TFLOPS for a single card.
That means a single GPU could potentially run at 17 / 312 = 54ms/token. We're using 16 of those so 3ms/token on the overall
machine. Take all these numbers with a big grain of salt, it's never possible to reach those numbers,
and real-life performance rarely matches the specs. Also if computation is not your limiting
factor then this is not the lowest you can get. It's just good practice to know how far you are from
your target. In this case, we're 2 orders of magnitude so pretty far. Also, this estimate puts
all the flops at the service of latency which means only a single request can go at a time (it's ok since you're maximizing your machine
so there's not much else to be done, but we can have higher latency and get throughput back through batching much more easily).
Exploring many routes
Note: Tensor Parallelism (TP) means in this context that each GPU will own
part of the weights, so ALL gpus are active all the time and do less work.
Usually this comes with a very slight overhead that some work is duplicated
and more importantly that the GPUs regularly have to communicate to each other
their results to continue the computation
Now that we have a good understanding of where we stand it's time to get to work.
We tried many different things based on the people and our various knowledge.
ALL endeavors deserve their own blog post so I'll just list them, explain the few final learnings and delve into the details of only what went into the current server. Moving from Pipeline Parallelism (PP) to Tensor Parallelism (TP) is one big interesting change for latency. Each GPU will own part of the parameters and all will be working at the same time. So the latency should decrease drastically but the price to pay is the communication overhead since they regularly need to communicate with each other about their results.
It is to note that this is a very wide range of approaches and the intent was deliberately to learn more about each tool and how it could fit in later endeavors.
Porting the code the JAX/Flax to run on TPUs:
- Expected to be easier to choose the type of parallelism. so TP should be easier to test. It's one of the perks of Jax's design.
- More constrained on hardware, performance on TPU likely superior than GPU, and less vendor choice for TPU.
- Cons, another port is needed. But it would be welcome anyway in our libs.
Results:
- Porting was not an easy task as some conditions and kernels were hard to reproduce correctly enough. Still manageable though.
- Parallelism was quite easy to get once ported Kudos to Jax the claim is alive.
- Ray/communicating with TPU workers proved to be a real pain for us. We don't know if its the tool, the network, or simply our lack of knowledge but it slowed down experiments and work much more than we anticipated. We would launch an experiment that takes 5mn to run, wait for 5mn nothing had happened, 10mn later still nothing, turned out some worker was down/not responding we had to manually get in, figure out what went on, fix it, restart something, and relaunch and we had just lost half an hour. Repeat that enough times, and lost days add up quickly. Let's emphasize that it's not necessarily a critique of the tools we used but the subjective experience we had remains.
- No control over compilation Once we had the thing running, we tried several settings to figure out which suited best the inference we had in mind, and it turned out it was really hard to guess from settings what would happen in the latency/throughput. For instance, we had a 0.3 rps on batch_size=1 (so every request/user is on its own) with a latency of 15ms/token (Do not compare too much with other numbers in this article it's on a different machine with a very different profile) which is great, but the overall throughput is not much better than what we had with the old code. So we decided to add batching, and with BS=2 and the latency went up 5 fold, with only 2 times the throughput... Upon further investigation, it turned out that up to batch_size=16 every batch_size had the same latency profile. So we could have 16x more throughput at a 5x latency cost. Not bad, but looking at the numbers we really would have preferred a more fine-grained control. The numbers we were aiming for stem from the 100ms, 1s, 10s, 1mn rule.
Using ONNX/TRT or other compiled approaches
- They are supposed to handle most of the optimization work
- Con, Usually parallelism needs to be handled manually.
Results:
- Turned out that to be able to trace/jit/export stuff we needed to rework part of the PyTorch, so it easily fused with the pure PyTorch approach And overall we figured out that we could have most of the optimizations we desired by staying within PyTorch world, enabling us to keep flexibility without having to make too much coding effort. Another thing to note, since we're running on GPU and text-generation has many forward passes going on, we need the tensors to stay on the GPU, and it is sometimes hard to send your tensors to some lib, be given back the result, perform the logits computation (like argmax or sampling) and feed it back again. Putting the loop within the external lib means losing flexibility just like Jax, so it was not envisioned in our use case.
DeepSpeed
- This is the technology that powered training, it seemed only fair to use it for inference
- Cons, it was never used/prepared for inference before.
Results:
- We had really impressive results fast which are roughly the same as the last iteration we are currently running.
- We had to invent a way to put a webserver (so dealing with concurrency) on top of DeepSpeed which also has several processes (one for each GPU). Since there is an excellent library Mii. It doesn't fit the extremely flexible goals we had in mind, but we probably would have started working on top of it now. (The current solution is discussed later).
- The biggest caveat we encountered with DeepSpeed, was the lack of stability. We had issues when running it on CUDA 11.4 where the code was built for 11.6 And the long-standing issue we could never really fix is that there would be regular kernel crashes (Cuda illegal access, dimensions mismatch, etc..). We fixed a bunch of these but we could never quite achieve stability under stress of our webserver. Despite, that I want to shout out to the Microsoft folks that helped us, we had a really good conversation that improved our understanding of what was happening, and gave us real insights to do some follow-up works.
- One of the pain points I feel is that our team is mostly in Europe, while Microsoft is in California, so the collaboration was tricky timewise and we probably lost a big chunk of time because of it. This has nothing to do with the technical part, but it's good to acknowledge that the organizational part of working together is also really important.
- Another thing to note, is that DeepSpeed relies on
transformersto inject its optimization, and since we were updating our code pretty much consistently it made it hard for the DeepSpeed team to keep things working on ourmainbranch. We're sorry to have made it hard, I guess this is why it's called bleeding edge.
Webserver ideas
- Given that we are going to run a free server where users are going to send long text, short text, want a few tokens, or a whole recipe each with different parameters, something had to be done here.
Results:
- We recoded everything in
Rustwith the excellent bindings tch-rs. Rust was not aimed at having performance gains but just much more fine-grained control over parallelism (threads/processes) and playing more fine-grained on the webserver concurrency and the PyTorch one. Python is infamously hard to handle low-level details thanks to the GIL. - Turned out that most of the pain came from the port, and after that, the experimentation was a breeze. And we figured that with enough control over the loops we could have great performance for everyone even in the context of a very wide array of requests with different properties. Code for the curious, but it doesn't come with any support or nice docs.
- It became production for a few weeks because it was more lenient on the parallelism, we could use the GPUs more efficiently (using GPU0 for request 1 while GPU1 is treating request 0). and we went from 0.3 RPS to ~2.5 RPS with the same latency. The optimal case would have been to increase throughput by 16X but the numbers shown here are real workloads measurements so this is not too bad.
Pure PyTorch
- Purely modify the existing code to make it faster by removing operations
like
reshape, using better-optimized kernels so on and so forth. - Con, we have to code TP ourselves and we have a constraint that the code still fits our library (mostly).
Results
- Next chapter.
Final route: PyTorch + TP + 1 custom kernel + torch.jit.script
Writing more efficient PyTorch
The first item on the list was removing unnecessary operations in the first implementations Some can be seen by just looking at the code and figuring out obvious flaws:
- Alibi is used in Bloom to add position embeddings and it was calculated in too many places, we could only calculate it once and more efficiently.
The old code: link The new code: link
This is a 10x speedup and the latest version includes padding too! Since this step is only computed once, the actual speed is not important but overall reducing the number of operations and tensor creation is a good direction.
Other parts come out more clearly when you start profiling and we used quite extensively the tensorboard extension
This provides this sort of image which give insights:
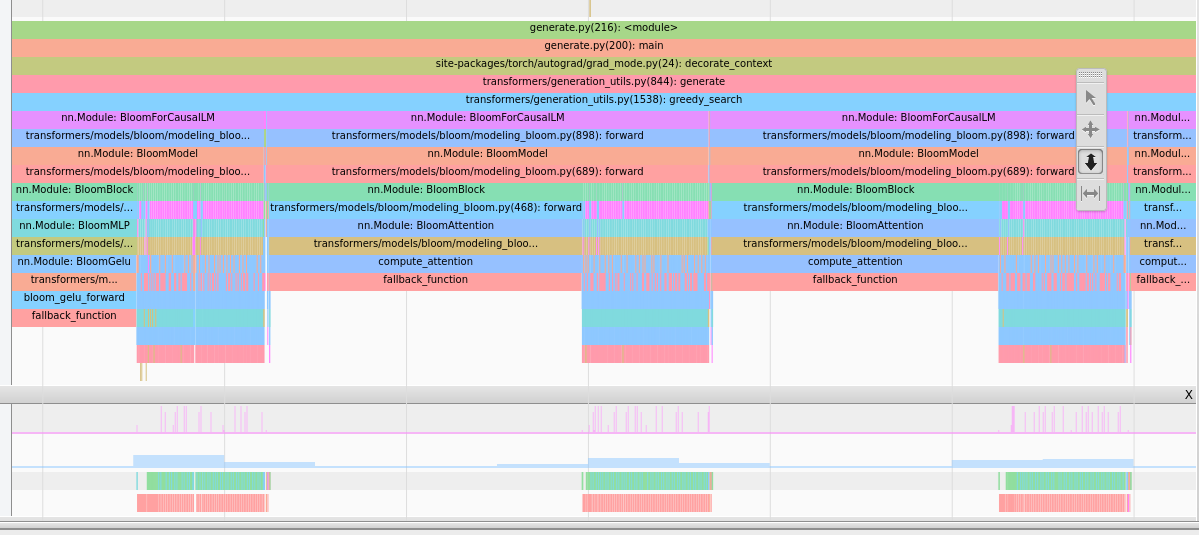 Attention takes a lot of time, careful this is a CPU view so the long
bars don't mean long, they mean the CPU is awaiting the GPU results of the
previous step.
Attention takes a lot of time, careful this is a CPU view so the long
bars don't mean long, they mean the CPU is awaiting the GPU results of the
previous step.
 We see many `cat` operations before `baddbmm`.
Removing a lot of reshape/transpose, for instance, we figured out that: - The attention is the hot path (it's expected but always good to verify). - In the attention, a lot of kernels were actual copies due to the massive amount of reshapes - We could remove the reshapes by reworking the weights themselves and the past. This is a breaking change but it did improve performance quite a bit!
Supporting TP
Ok, we have removed most of the low-hanging fruits now we went roughly from 350ms/token latency to 300ms/token in PP. That's a 15% reduction in latency, but it actually provided more than that, but we were not extremely rigorous in our measuring initially so let's stick to that figure.
Then we went on to provide a TP implementation. Turned out to be much faster than we anticipated the implementation took half a day of a single (experienced) dev. The result is here. We were also able to reuse code from other projects which helped.
The latency went directly from 300ms/token to 91ms/token which is a huge improvement in user experience. A simple 20 tokens request went from 6s to 2s which went from a "slow" experience to slightly delayed.
Also, the throughput went up a lot to 10RPS. The throughput comes from the fact that running a query in batch_size=1 takes the same time as batch_size=32 and throughput becomes essentially free in latency cost at this point.
Low-hanging fruits
Now that we had a TP implementation, we could start profiling and optimizing again. It's a significant enough shift that we had to start from scratch again.
The first thing that stood out, is that synchronization (ncclAllReduce) starts
to become a preponderant part of the load, which is expected, this is the synchronization
part and it is taking some time. We never tried to look and optimize this as it's
already using nccl but there might still be some room for improvement there.
We assumed it would be hard to do much better.
The second thing is that Gelu operator was launching many elementwise
kernels and overall it was taking a bigger share of compute than we expected.
We made the change from:
def bloom_gelu_forward(x):
    return x * 0.5 * (1.0 + torch.tanh(0.79788456 * x * (1 + 0.044715 * x * x)))
to
@torch.jit.script
def bloom_gelu_forward(x):
    return x * 0.5 * (1.0 + torch.tanh(0.79788456 * x * (1 + 0.044715 * x * x)))
This transforms the operations from multiple small element-wise kernels (and hence tensor copies) to a single kernel operation!
This provided a 10% latency improvement from 91ms/token to 81ms/token, right there!
Be careful though, this is not some magic black box you can just throw everywhere, the kernel fusion will not necessarily happen or the previously used operations are already extremely efficient.
Places where we found it worked well:
- You have a lot of small/elementwise operations
- You have a hotspot with a few hard-to-remove reshape, copies in general
- When the fusion happens.
Epic fail
We also had some points, during our testing periods, where we ended up seeing some consistent 25% lower latency for the Rust server compared to the Python one. This was rather odd, but because it was consistently measured, and because removing kernels provided a speed up, we were under the impression that maybe dropping the Python overhead could provide a nice boost.
We started a 3-day job to reimplement the necessary parts of torch.distributed
To get up and running in the Rust world nccl-rs.
We had the version working but something was off in the generations compared to its
Python counterpart. During the investigation of the issues, we figured...
that we had forgotten to remove the profiler in the Pytorch measurements...
That was the epic fail because removing it gave us back the 25% and then both codes ran just as fast. This is what we initially expected, that python mustn't be a performance hit, since it's mostly running torch cpp's code. In the end, 3 days is not the end of the world, and it might become useful sometime in the future but still pretty bad. This is quite common when doing optimizations to do wrong or misrepresentative measurements which end up being disappointing or even detrimental to the overall product. This is why doing it in small steps and having expectations about the outcome as soon as possible helps contain that risk.
Another place where we had to be extra careful, was the initial forward pass (without
past) and the later forward passes (with past). If you optimize the first one,
you're most certainly going to be slowing down the later ones which are much more
important and account for most of the runtime.
Another pretty common culprit is measuring times which are CPU times, and not
actual CUDA times, so you need to torch.cuda.synchronize() when doing
runs to be sure that the kernels complete.
Custom kernel
So far, we had achieved close to DeepSpeed performance without any custom code outside of PyTorch! Pretty neat. We also didn't have to make any compromise on the flexibility of the run time batch size!
But given the DeepSpeed experience, we wanted to try and write a custom kernel
to fuse a few operations in the hot path where torch.jit.script wasn't able to
do it for us. Essentially the following two lines:
attn_weights = attention_scores.masked_fill_(attention_mask, torch.finfo(attention_scores.dtype).min)
attention_probs = F.softmax(attn_weights, dim=-1, dtype=torch.float32).to(input_dtype)
The first masked fill is creating a new tensor, which is here only to say to the softmax operator to ignore those values. Also, the softmax needs to be calculated on float32 (for stability) but within a custom kernel, we could limit the amount of upcasting necessary so we limit them to the actual sums and accumulated needed.
Code can be found here. Keep in mind we had a single GPU architecture to target so we could focus on this and we are not experts (yet) at writing kernels, so there could be better ways to do this.
This custom kernel provided yet another 10% latency increase moving down from 81ms/token to 71ms/token latency. All the while keeping our flexibility.
After that, we investigated and explored other things like fusing more operators removing other reshapes, or putting them in other places. But no attempt ever made a significant enough impact to make it to the final versions.
Webserver part
Just like the Rust counterpart, we had to implement the batching of requests
with different parameters. Since we were in the PyTorch world, we have pretty
much full control of what's going on.
Since we're in Python, we have the limiting factor that the torch.distributed
needs to run on several processes instead of threads, which means it's slightly
harder to communicate between processes. In the end, we opted to communicate
raw strings over a Redis pub/sub to distribute the requests to all processes at once.
Since we are in different processes it's easier to do it that way than communicating
tensors (which are way bigger) for instance.
Then we had to drop the use generate since this applies the parameters to all members of the batch, and we actually want to apply a different set of parameters. Thankfully, we can reuse lower-level items like the LogitsProcessor to save us a lot of work.
So we reconstructed a generate function that takes a list of parameters
and applies them to each member of the batch.
Another really important aspect of the final UX is latency. Since we have different parameter sets for different requests, we might have
1 request for 20 tokens and the other for 250 tokens. Since it takes 75ms/token latency one request takes 1.5s and the other 18s. If we were batching all the way, we would be making the user that asked to wait for 18s and making it appear to him as if we were running at 900ms/token which is quite slow!
Since we're in a PyTorch world with extreme flexibility, what we can do instead is extract from the batch the first request as soon as we generated to first 20 tokens, and return to that user within the requested 1.5s! We also happen to save 230 tokens worth of computation.
So flexibility is important to get the best possible latency out there.
Last notes and crazy ideas
Optimization is a never-ending job, and like any other project, 20% of work will usually yield 80% of the results. At some point, we started having a small testing strategy to figure out potential yields of some idea we had, and if the tests didn't yield significant results then we discarded the idea. 1 day for a 10% increase is valuable enough, 2 weeks for 10X is valuable enough. 2 weeks for 10% is not so interesting.
Have you tried ...?
Stuff we know exists and haven't used because of various reasons. It could be it felt like it wasn't adapted to our use case, it was too much work, the yields weren't promising enough, or even simply we had too many options to try out from and discarded some for no particular reasons and just lack of time. The following are in no particular order:
- Cuda graphs
- nvFuser (This is what powers
torch.jit.scriptso we did use it.) - FasterTransformer
- Nvidia's Triton
- XLA (Jax is using xla too !)
- torch.fx
- TensorRT
Please feel free to reach out if your favorite tool is missing from here or if you think we missed out on something important that could prove useful!
Flash attention
We have briefly looked at integrating flash attention, and while it performs extremely
well on the first forward pass (without past_key_values) it didn't yield as big improvements
when running when using past_key_values. Since we needed to adapt it to include the alibi tensor
in the calculation we decide to not do the work (at least not yet).
OpenAI Triton
Triton is a great framework for building custom kernels in Python. We want to get to use it more but we haven't so far. We would be eager to see if it performs better than our Cuda kernel. Writing directly in Cuda seemed like the shortest path for our goal when we considered our options for that part.
Padding and Reshapes
As mentioned throughout this article, every tensor copy has a cost and another hidden cost of running production is padding. When two queries come in with very different lengths, you have to pad (use a dummy token) to make them fit a square. This leads to maybe a lot of unnecessary calculations. More information.
Ideally, we would be able to not do those calculations at all, and never have reshapes. Tensorflow has the concept of RaggedTensor and Pytorch Nested tensors. Both of these seem not as streamlined as regular tensors but might enable us to do less computation which is always a win.
In an ideal world, the entire inference would be written in CUDA or pure GPU implementation. Considering the performance improvements yielded when we could fuse operations it looks desirable. But to what extent this would deliver, we have no idea. If smarter GPU people have ideas we are listening!
Acknowledgments
All this work results of the collaboration of many HF team members. In no particular order, @ThomasWang @stas @Nouamane @Suraj @Sanchit @Patrick @Younes @Sylvain @Jeff (Microsoft) @Reza And all the BigScience organization.